|
一、实验目的: 1、观测0型系统的脉冲响应、阶跃响应和斜坡响应,并测量稳态误差; 2、观测Ⅰ型系统的脉冲响应、阶跃响应和斜坡响应,并测量稳态误差; 3、观测Ⅱ型系统的脉冲响应、斜坡响应和抛物线响应,并测量稳态误差。 二、实验内容: 

设系统开环传递函数一般表达式为  (n≥m) (n≥m)
则系统的稳态误差可表示为 
设 0型系统的开环传递函数为 Ⅰ型系统的开环传递函数为 Ⅱ型系统的开环传递函数为 实验问题:6、系统开环传递函数如下 
T1=0.3,T2=0.4,要求如下: - v=0;K=1,3,5,8时观察系统阶跃响应和斜坡响应,并测量其稳态误差;
- v=1; K=1,3,5,8时观察系统阶跃响应和斜坡响应,并测量其稳态误差;
- v=2; K=1,3,5,8时观察系统阶跃响应和斜坡响应,并测量其稳态误差;
- 说明系统型别和K的参数对稳态误差的影响。
- (1)v=0;K=1,3,5,8时观察系统阶跃响应和斜坡响应,并测量其稳态误差
阶跃程序:t=0:0.1:20
[num1,den1]=cloop([1],[0.12 0.7 1]);
[num2,den2]=cloop([3],[0.12 0.7 1]);
[num3,den3]=cloop([5],[0.12 0.7 1]);
[num4,den4]=cloop([8],[0.12 0.7 1]);
y1=step(num1,den1,t);
y2=step(num2,den2,t);
y3=step(num3,den3,t);
y4=step(num4,den4,t);
subplot(411);plot(t,y1);
subplot(412);plot(t,y2);
subplot(413);plot(t,y3);
subplot(414);plot(t,y4);
er1=1-y1(length(t));
er2=1-y2(length(t));
er3=1-y3(length(t));
er4=1-y4(length(t));
斜坡程序:t=0:0.1:20
t1=0:0.1:100;
[num1,den1]=cloop([1],[0.12 0.7 1]);
[num2,den2]=cloop([3],[0.12 0.7 1]);
[num3,den3]=cloop([5],[0.12 0.7 1]);
[num4,den4]=cloop([8],[0.12 0.7 1]);
y1=step(num1,[den1 0],t1);
y2=step(num2,[den2 0],t);
y3=step(num3,[den3 0],t);
y4=step(num4,[den4 0],t);
subplot(411);plot(t1,y1,t1,t1);
subplot(412);plot(t,y2,t,t);
subplot(413);plot(t,y3,t,t);
subplot(414);plot(t,y4,t,t);
er1=t1(length(t1))-y1(length(t1));
er2=t(length(t))-y2(length(t));
er3=t(length(t))-y3(length(t));
er4=t(length(t))-y4(length(t));

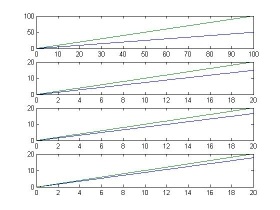
(2)v=1;K=1,3,5,8时观察系统阶跃响应和斜坡响应,并测量其稳态误差
阶跃程序:t=0:0.1:20
[num1,den1]=cloop([1],[0.12 0.7 1 0]);
[num2,den2]=cloop([3],[0.12 0.7 1 0]);
[num3,den3]=cloop([5],[0.12 0.7 1 0]);
[num4,den4]=cloop([8],[0.12 0.7 1 0]);
y1=step(num1,den1,t);
y2=step(num2,den2,t);
y3=step(num3,den3,t);
y4=step(num4,den4,t);
subplot(411);plot(t,y1);
subplot(412);plot(t,y2);
subplot(413);plot(t,y3);
subplot(414);plot(t,y4);
er1=1-y1(length(t));
er2=1-y2(length(t));
er3=1-y3(length(t));
er4=1-y4(length(t));
斜坡程序:t=0:0.1:20
t1=0:0.1:100;
[num1,den1]=cloop([1],[0.12 0.7 1 0]);
[num2,den2]=cloop([3],[0.12 0.7 1 0]);
[num3,den3]=cloop([5],[0.12 0.7 1 0]);
[num4,den4]=cloop([8],[0.12 0.7 1 0]);
y1=step(num1,[den1 0],t1);
y2=step(num2,[den2 0],t);
y3=step(num3,[den3 0],t);
y4=step(num4,[den4 0],t);
subplot(411);plot(t1,y1,t1,t1);
subplot(412);plot(t,y2,t,t);
subplot(413);plot(t,y3,t,t);
subplot(414);plot(t,y4,t,t);
er1=t1(length(t1))-y1(length(t1));
er2=t(length(t))-y2(length(t));
er3=t(length(t))-y3(length(t));
er4=t(length(t))-y4(length(t));
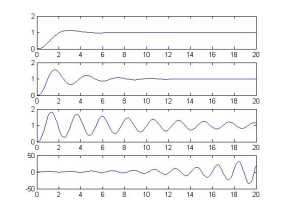
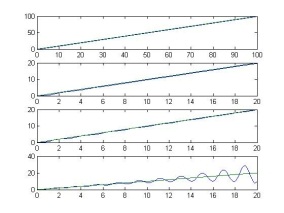
- (3)v=2;K=1,3,5,8时观察系统阶跃响应和斜坡响应,并测量其稳态误差;
阶跃程序:t=0:0.1:20 [num1,den1]=cloop([1],[0.12 0.7 1 0 0]); [num2,den2]=cloop([3],[0.12 0.7 1 0 0]); [num3,den3]=cloop([5],[0.12 0.7 1 0 0]); [num4,den4]=cloop([8],[0.12 0.7 1 0 0]); y1=step(num1,den1,t); y2=step(num2,den2,t); y3=step(num3,den3,t); y4=step(num4,den4,t); subplot(411);plot(t,y1); subplot(412);plot(t,y2); subplot(413);plot(t,y3); subplot(414);plot(t,y4); er1=1-y1(length(t)); er2=1-y2(length(t)); er3=1-y3(length(t)); er4=1-y4(length(t)); 斜坡程序:t=0:0.1:20 t1=0:0.1:100; [num1,den1]=cloop([1],[0.12 0.7 1 0]); [num2,den2]=cloop([3],[0.12 0.7 1 0]); [num3,den3]=cloop([5],[0.12 0.7 1 0]); [num4,den4]=cloop([8],[0.12 0.7 1 0]); y1=step(num1,[den1 0],t1); y2=step(num2,[den2 0],t); y3=step(num3,[den3 0],t); y4=step(num4,[den4 0],t); subplot(411);plot(t1,y1,t1,t1); subplot(412);plot(t,y2,t,t); subplot(413);plot(t,y3,t,t); subplot(414);plot(t,y4,t,t); er1=t1(length(t1))-y1(length(t1)); er2=t(length(t))-y2(length(t)); er3=t(length(t))-y3(length(t)); er4=t(length(t))-y4(length(t)); 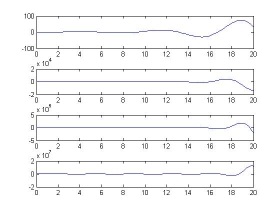
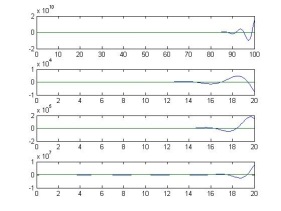
(4)说明系统型别和K的参数对稳态误差的影响。 在阶跃输入作用下,仅0型系统有稳态误差,其大小与阶跃输入的幅值成正比,与系统的开环增益成反比。对I型及I型以上的系统,其稳态误差为0 在斜坡输入之下,0型系统的输出量不能跟踪其输入量的变化,这是因为输出量的速度小于输入量的速度,导致两者的差距不断增大,稳态误差趋于无穷大,稳态时,I型系统的输出量与输入量虽以相同的速度变化,但前者较后者在位置上落后一个常量,这个常量就是稳态误差。稳态情况下II型及II型以系统的输出量与输入量不仅速度相等,而且位置相同。
完整的Word格式文档51黑下载地址:
 实验四实验报告.docx
(161.5 KB, 下载次数: 6)
|